Examining Varnish Server’s Output
In this chapter you will learn about:
- log records,
- statistics out from global counters and the Varnish log,
- the log layout,
- transactions,
- the query language, and
- notable counters.
Varnish logs information of requests, caches and responses to The Varnish Shared memory Log (VSL). Logs are available through Varnish tools with a short delay, but usually not noticeable. The VSL is overwritten when filled-up in circular order.
The memory log overwriting has two effects. On the one hand, there is no historic data, but on the other hand, there is an abundance of information accessible at a very high speed. Still, you can instruct Varnish to store logs in files.
Varnish generates very large amounts of data, therefore it does not write logs to disk by default, but only to memory.
However, if you need to enable logging to disk, as when debugging a crashing Varnish installation, you set VARNISHNCSA_ENABLED=1 or VARNISHNCSA_ENABLED=1 in /etc/default/varnishlog or /etc/default/varnishncsa respectively.
Table 2 shows the location of the configuration file based on different platforms.
Varnish provides specific tools to parse the content of logs: varnishlog, varnishncsa, varnishstat, and varnishstat among others.
varnishlog and varnishstat are the two most common used tools.
Tip
All utility programs have installed reference manuals.
Use the man command to retrieve their manual pages.
Log Data Tools
Tools to display detailed log records:
varnishlogis used to access request-specific data. It provides information about specific clients and requests.varnishncsadisplays Varnish access logs in NCSA Common log format.varnishtestallows you to display log records and counters from your tests.
Statistical tools:
varnishstatis used to access global counters.varnishtopreads the Varnish log and presents a continuously updated list of the most commonly occurring log entries.varnishhistreads the Varnish log and presents a continuously updated histogram showing the distribution of the last N requests by their processing.
If you have multiple Varnish instances running in the same machine, you need to specify -n <name> both when starting Varnish and when using the tools.
This option is used to specify the instance of varnishd, or the location of the shared memory log.
All tools (including varnishadm) can also take a -n option.
In this course, we focus on the two most important tools: varnishlog and varnishstat.
Unlike all other tools, varnishstat does not read entries from the Varnish log, but from global counters.
You can find more details about the other Varnish tools varnishncsa, varnishtop and varnishhist in Appendix B: Varnish Programs.
Log Layout

Fig. 7 Log Layout Timeline
Varnish logs transactions chronologically as Fig. 7 shows.
The varnishlog is one of the most used tools and offers mechanisms to reorder transactions grouped by TCP session, frontend- or backend worker.
We talk more on transactions in the next subsection.
The various arguments of varnishlog are mostly designed to help you find exactly what you want, and filter out the noise.
On production traffic, the amount of log data that Varnish produces is staggering, and filtering is a requirement for using varnishlog effectively.
Next section explains transactions and how to reorder them.
varnishtest starts a real varnishd process for each test, therefore it also logs in VSL.
When your Varnish test fails or you run varnishtest in verbose mode, you can see the vsl entry for each Varnish log record.
You can also use the logexpect to assert the expected behavior in your tests.
Transactions
$ varnishlog -g <session|request|vxid|raw> -d
- You can see transactions in groups
<session|request|vxid|raw> - The default is to group by
vxid - The sooner a transaction ends, the sooner you see it
-dreads all existing records in the shared memory log (VSL) instead of showing only last transactions- See Fig. 8 and Fig. 9 in the book

Fig. 8 Transactions Grouping

Fig. 9 VXIDs in Log Layout
A transaction is one work item in Varnish and it is a set of log lines that belong together, e.g., a client request or a backend request.
Varnish Transaction IDs (VXIDs) are applied to lots of different kinds of work items.
A unique VXID is assigned to each type of transaction.
The 0 VXID is reserved for everything that Varnish does but not part of a specific transaction.
You can follow the VXID when you analyze the log through varnishlog or varnishtest.
Transaction types are:
session: TCP sessionrequest: Transaction handled by the frontend- or backend worker
Varnish logs are grouped by VXID by default.
For example, when viewing a log for a simple cache miss, you see logs in the order they end.
That is: 1) backend request (BeReq), 2) client request (Request) and 3) session (Session).
Each transaction has a reason, for examples:
- Client request
- ESI request
- restart
- fetch
To learn more about this topic in varnishtest, refer to the section: Example of Transactions in varnishtest.
Transaction Groups
-g <session | request | vxid | raw>groups together transactions invarnishlogandvarnishtestTransaction groups are hierarchical
Levels are equal to relationships (parents and children):
Level 1: Client request (cache miss)
  Level 2: Backend request
  Level 2: ESI subrequest (cache miss)
    Level 3: Backend request
    Level 3: Backend request (VCL restart)
    Level 3: ESI subrequest (cache miss)
      Level 4: Backend request
  Level 2: ESI subrequest (cache hit)
When grouping transactions, there is a hierarchy structure showing which transaction initiated what. In client request grouping mode, the various work items are logged together with their originating client request. For example, a client request that triggers a backend request might trigger two more ESI subrequests, which in turn might trigger yet another ESI subrequest.
All these requests together with the client response are arranged in the order they are initiated. This arrangement is easier to grasp than when grouping by VXID. The Content Composition section shows how to analyze the log for Edge Side Includes (ESI) transactions.
When a subrequest occurs in the log, the subrequest tells us about the relationship to its parent request through the Link statement.
This statement contains the VXID of the parent request.
varnishlog indents its output based on the level of the request, making it easier to see the level of the current request.
Example of Transaction Grouping with varnishlog
$ varnishlog -g request -i Begin,Link -d

Fig. 10 Example of Transaction Grouping with varnishlog
Fig. 10 shows a client request in a cache miss scenario.
In the figure, varnishlog returns records grouped by request.
For simplicity, we use the -i option to include only the Begin and Link tags.
For more information about the format and content of all Varnish shared memory logging (VSL) tags, see the VSL man page by typing man vsl.
The workflow of Varnish is detailed in the VCL Basics chapter.
To reproduce the example, issue http -p hH http://localhost/, and then the varnishlog command as above.
The -d option processes all recorded entries in Varnish log.
To learn more about the available varnishlog options, enter varnishlog -h or see the varnishlog man page.
varnishlog accepts all options that are syntactically correct.
The output, however, might be different from your first interpretation.
Therefore, you should make sure that your results make sense.
Options -b and -c display only transactions coming from the backend and client communication respectively.
You can verify the meaning of your results by double checking the filters, and separating your results with the -b and -c options.
Note
The logexpect command from varnishtest accepts the same arguments as varnishlog.
Query Language
- Operates on transaction groups.
- Query expression is true if it matches one or more records, false otherwise.
- Supports:
- string matching, e.g.:
RespProtocol eq "HTTP/1.1" - regex, e.g.:
ReqMethod ~ "GET|POST" - integer and float matching, e.g.:
RespStatus == 200 - boolean operators, e.g.:
RespStatus >= 500 and RespStatus < 600 - parenthesis hierarchy
- string matching, e.g.:
- Operators:
== != < <= > >= eq ne ~ !~ - Operands:
a-z A-Z 0-9 + - _ . *
Examples of Varnish log queries:
varnishlog -q 'VCL_call ~MISS'
varnishlog -i Timestamp
Requests taking more than 5 seconds:
varnishlog -q 'Timestamp:Fetch[2] > 5.0'
timestamp contains timing information for the varnish worker threads.
The -q option allows you to add a query to varnishlog.
Think of it as a sort of select filter for varnishlog.
It works together with the grouping so that if the query matches some part of any of the work items in the transaction group, the whole group matches and gets displayed.
Query expressions can be combined using boolean functions.
In addition, there are many output control options, such as -i taglist.
These options are output filters, thus they do not affect transaction matching.
Output controls are applied last.
A query expression consists of record selection criteria, and optionally an operator and a value to match against the selected records:
<record selection criteria> <operator> <operand>
The <record selection criteria> determines what kind of records from the transaction group the expression applies to.
The syntax is:
{level}taglist:record-prefix[field]
For example:
- Response time exceeds 1⁄2 second
Timestamp:Process[2] > 0.5 - Client requests connection closed
ReqHeader:connection ~ close - ESI miss (-g request)
{3+}Begin ~ Bereq
Taglists are not case-sensitive, but we recommend you to follow the same format as declared in man vsl.
The grouping and the query log processing all happens in the varnishlog API.
This means that other programs using this API automatically get grouping and query language, just as logexpect does.
See logexpect to learn more about it.
Tip
man vsl-query shows you more details about query expressions.
man vsl lists all taglists and their syntax.
Exercise: Filter Varnish Log Records
- Provoke Varnish to get the Service Unavailable (
RespStatus == 503) response from the backend - Use
varnishlogto filter and print only this error
There are multiple ways to provoke your backend fail. For example, misconfigure your backend in Varnish or stop your backend.
You can filter and print specific messages from the varnishlog in many ways.
The purpose of this exercise is to use the query option -q, but you can also use the include tags option -i or -I and the grep command.
Note
You can also use varnishtest to provoke a Service Unavailable response and assert it by reading VSL with logexpect.
varnishstat
Uptime mgt:   1+23:38:08                                                                Hitrate n:       10      100      438
Uptime child: 1+23:38:08                                                                   avg(n):   0.9967   0.5686   0.3870

NAME                                               CURRENT       CHANGE      AVERAGE       AVG_10      AVG_100     AVG_1000
MAIN.uptime                                           171488         1.00         1.00         1.00         1.00         1.00
MAIN.sess_conn                                          1055         7.98          .           8.35         4.49         2.11
MAIN.client_req                                         1055         7.98          .           8.35         4.49         2.11
MAIN.cache_hit                                          1052         7.98          .           8.35         4.49         2.10
MAIN.cache_miss                                            3         0.00          .           0.00         0.00         0.00
MAIN.backend_conn                                          4         0.00          .           0.00         0.00         0.01
MAIN.backend_toolate                                       3         0.00          .           0.00         0.00         0.01
MAIN.backend_recycle                                       4         0.00          .           0.00         0.00         0.01
MAIN.fetch_length                                          4         0.00          .           0.00         0.00         0.01
MAIN.pools                                                 2         0.00          .           2.00         2.00         2.00
MAIN.threads                                             200         0.00          .         200.00       200.00       200.00
MAIN.threads_created                                     200         0.00          .           0.00         0.00         0.00
MAIN.n_object                                              1         0.00          .           1.00         0.85         0.81
MAIN.n_objectcore                                          3         0.00          .           3.00         2.85         2.81
MAIN.n_objecthead                                          4         0.00          .           4.00         3.89         3.83
MAIN.n_backend                                             1         0.00          .           1.00         1.00         1.00
MAIN.n_expired                                             2         0.00          .           2.00         1.76         1.33
MAIN.s_sess                                             1055         7.98          .           8.35         4.49         2.11
MAIN.s_req                                              1055         7.98          .           8.35         4.49         2.11
MAIN.s_fetch                                               3         0.00          .           0.00         0.00         0.00
MAIN.s_req_hdrbytes                                   122380       926.07          .         968.24       520.74       244.35
MAIN.s_resp_hdrbytes                                  376249      2854.04         2.00      2982.17      1602.59       751.87
MAIN.s_resp_bodybytes                                3435094     25993.71        20.00     27177.59     14616.67      6858.74
MAIN.backend_req                                           4         0.00          .           0.00         0.00         0.01
MAIN.n_vcl                                                 1         0.00          .           0.00         0.00         0.00
MAIN.bans                                                  1         0.00          .           1.00         1.00         1.00
MAIN.n_gunzip                                              4         0.00          .           0.00         0.00         0.01

MAIN.cache_hit                                                                                                         INFO
Cache hits:
Count of cache hits. A cache hit indicates that an object has been delivered to a client without fetching it from a
backend server.
| Column | Description |
|---|---|
| Name | The name of the counter |
| Current | The current value of the counter. |
| Change | The average per second change over the last update interval. |
| Average | The average value of this counter over the runtime of the Varnish daemon, or a period if the counter can’t be averaged. |
| Avg_10 | The moving average over the last 10 update intervals. |
| Avg_100 | The moving average over the last 100 update intervals. |
| Avg_1000 | The moving average over the last 1000 update intervals. |
varnishstat looks only at counters, which give a good representation of the general health of Varnish.
Counters, unlike the rest of the log, are not directly mapped to a single request, but represent how many times a specific action has occurred since Varnish started.
These counters are easily found in VSL, and are typically polled at reasonable interval to give the impression of real-time updates.
varnishstat can be used to determine the request rate, memory usage, thread usage, number of failed backend connections, and more.
varnishstat gives you information just about anything that is not related to a specific request.
There are over a hundred different counters available.
To increase the usefulness of varnishstat, only counters with a value different from 0 are shown by default.
varnishstat can be used interactively, or it can display the current values of all the counters with the -1 option.
Both methods allow you to specify specific counters using -f field1 -f field2 .. to limit the list.
In interactive mode, varnishstat has three areas.
The top area shows process uptime and hitrate information.
The center area shows a list of counter values.
The bottom area shows the description of the currently selected counter.
Hitrate n and avg(n) are related, where n is the number intervals.
avg(n) measures the cache hit rate within n intervals.
The default interval time is one second.
You can configure the interval time with the -w option.
Since there is no historical data of counters changes, varnishstat has to compute the average while it is running.
Therefore, when you start varnishstat, the values of Hitrate n start at 1, then they increase to 10, 100 and 1000.
In the above example, the interval is one second.
The hitrate average avg(n) show data for the last 10, 100, and 438 seconds.
The average hitrate is 0.9967 (or 99.67%) for the last 10 seconds, 0.5686 for the last 100 seconds and 0.3870 for the last 438 seconds.
In the above example, Varnish has served 1055 requests and is currently serving roughly 7.98 requests per second.
Some counters do not have “per interval” data, but are gauges with values that increase and decrease.
Gauges start with a g_ prefix.
Tip
You can also see many parameters in real-time graphs with the Varnish Administration Console (VAC).
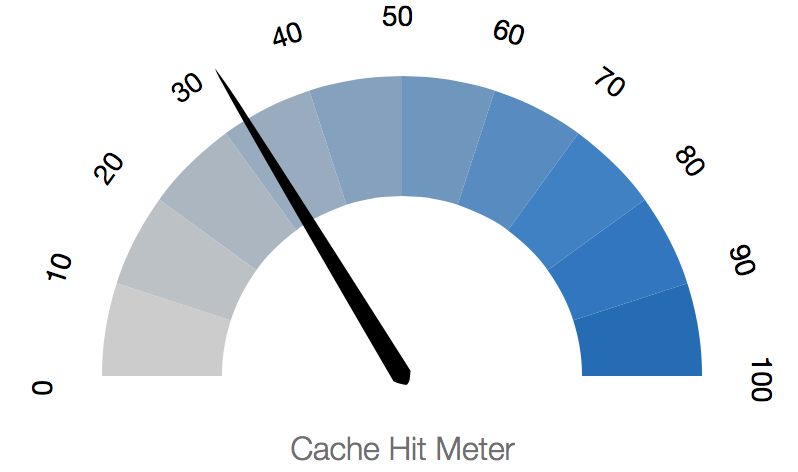
Fig. 11 Cache Hit Meter
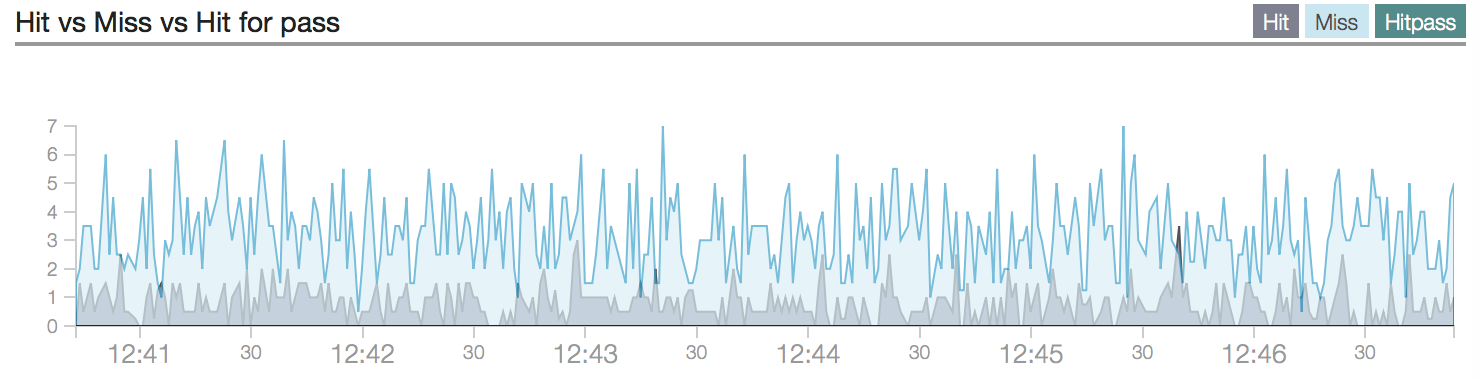
Fig. 12 Hit vs Miss vs Hit for Pass
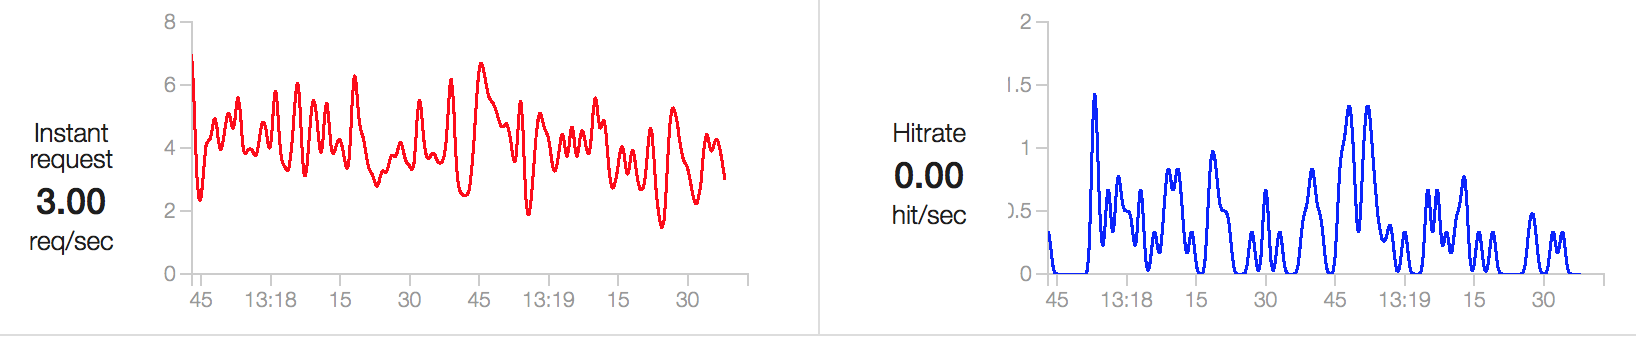
Fig. 13 Req/sec, and Hit/sec
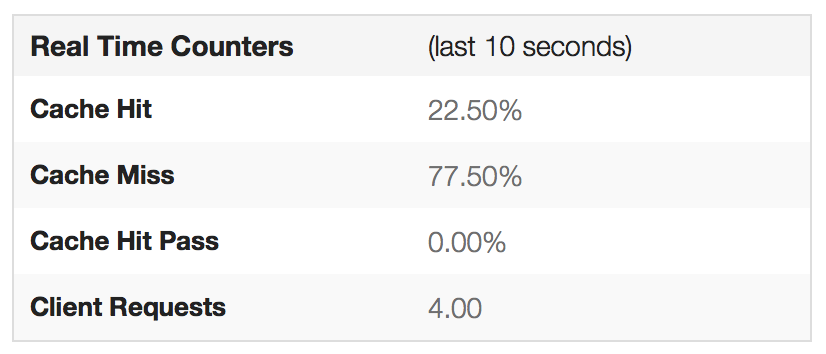
Fig. 14 Real Time Counters
Tip
If you need to collect statistics from more than a single Varnish server, Varnish Custom Statistics (VCS) allows you to do that. In addition, VCS allows you to define your metrics to collect and analyze aggregated statistics, for example:
- A/B testing
- Measuring click-through rate
- Track slow pages and cache misses
- Analyze what is “hot” right now in a news website
- Track changes in currency conversions in e-commerce
- Track changes in Stock Keeping Units (SKUs) behavior in e-commerce
- Track number of unique consumers of HLS/HDS/DASH video streams
Notable Counters
| Counter | Description |
|---|---|
MAIN.cache_hit |
Indicates the number of objects delivered to clients without fetching them from the backend |
MAIN.cache_hitpass |
Counts how many times the hit-for-pass object has been hit, i.e., Varnish passes the request to the backend. |
MAIN.cache_miss |
Shows how many requested objects were fetched from the backend |
MAIN.client_req |
Number of parseable client requests received |
MAIN.threads_limited |
Counts how many times varnishd hits the maximum allowed number of threads. The maximum number of Varnish threads is given by the parameter thread_pool_max. Issue the command varnishadm param.show thread_pool_max to see this parameter. |
MAIN.threads_failed |
Increases every time pthread_create() fails. You can avoid this situation by tuning the maximum number of processes available with the ulimit -u command. You may also look at the thread-max Linux parameter in /proc/sys/kernel/threads-max. |
MAIN.thread_queue_len |
Shows the current number of sessions waiting for a thread. This counter is first introduced in Varnish 4. |
MAIN.sess_queued |
Contains the number of sessions that are queued because there are no available threads immediately. Consider to increase the thread_pool_min parameter. |
MAIN.sess_dropped |
Counts how many times sessions are dropped because varnishd hits the maximum thread queue length. You may consider to increase the thread_queue_limit Varnish parameter as a solution to drop less sessions. |
MAIN.n_lru_nuked |
Number of least recently used (LRU) objects thrown out to make room for new objects. If this is zero, there is no reason to enlarge your cache. Otherwise, your cache is evicting objects due to space constraints. In this case, consider increasing the size of your cache. |
MAIN.n_object |
Number of cached objects |
Varnish provides a large number of counters for information and debugging purposes. Table 7 presents counters that are typically important. Other counters may be relevant only for Varnish developers when providing support.
Counters also provide feedback to Varnish developers on how Varnish works in production environments.
This feedback in turn allows Varnish to be developed according to its real usage.
Issue varnishstat -1 to list all counters with their current values.
Note
If you have many backends, consider to increase the size of the shared memory log.
For that, see the option -l in the man page of varnishd.
Tip
Remember that Varnish provides many reference manuals.
To see all Varnish counter field definitions, issue man varnish-counters.
Exercise: Try varnishstat and varnishlog together
- Run
varnishstatandvarnishlogwhile performing a few requests. - See, analyze and understand how counters and parameters change in
varnishstatandvarnishlog.
varnishtest.
If you are done with this exercise and have still time, try to assert some counters as described in Exercise: Assert Counters in varnishtest.