Varnish Plus Software Components
The Varnish Plus offer of software products includes:
- Varnish Massive Storage Engine (MSE) described in Storage Backends,
- Hashtwo (Varnish Software Implementation of Surrogate Keys) described in Hashtwo/Xkey (Varnish Software Implementation of Surrogate Keys),
- Varnish Administration Console (VAC),
- Varnish Custom Statistics (VCS),
- Varnish High Availability (VHA),
- SSL/TLS frontend support with hitch,
- and more.
For more information about the complete Varnish Plus offer and their documentation, please visit:
Varnish Administration Console (VAC)
- Single point of control for simultaneous administration of multiple Varnish Cache servers
- VAC provides:
- GUI
- API
- Super Fast Purger
- VAC has its own documentation
The Varnish Administration Console (VAC) consists of a GUI and an API. VAC is most commonly used in production environments where real-time graphs and statistics help identify bottlenecks and issues within Varnish Cache servers. VAC is a management console for groups of Varnish Cache servers, also known as cache groups. A cache group is a collection of Varnish Cache servers that have identical configuration. Attributes on a cache group includes:
- One or more Varnish Cache servers
- Active Varnish Configuration Language (VCL) file
- Homogeneous parameter configuration across all servers in a group
VAC distributes and store VCL files for you. A parameter set is a list of Varnish cache parameters. These parameters can be applied to one or more cache groups simultaneously, as long as all cache groups consist of cache servers of the same version.
VAC ships with a JSON-based RESTful API to integrate your own systems with the VAC. All actions performed via the user interface can be replicated with direct access to the API. This includes fetching all real-time graph data.
The Super Fast Purger is a high performance cache invalidation delivery mechanism for multiple installations of Varnish. Super Fast Purger is capable of distributing purge requests to cache groups across data centers via the Restful interface. Super Fast Purger uses HMAC as security mechanism to protect your purge requests and thus ensure data integrity.
In order to install VAC on either Debian/Ubuntu or Red Hat Enterprise, one would require access to the Varnish Plus Software repository. As a Varnish Plus customer, you have access to the installation guide document. This document has instructions to install, configure, maintain, and troubleshoot your VAC installation If you have any questions on how to set up your repository or where to obtain the VAC installation guide, please ask the instructor or send us an email to support@varnish-software.com.
Fig. 26, Fig. 27 and Fig. 28 show screenshots of the GUI. You may also be interested in trying the VAC demo at https://vacdemo.varnish-software.com. The instructor of the course provides you the credentials.
Overview Page of the Varnish Administration Console
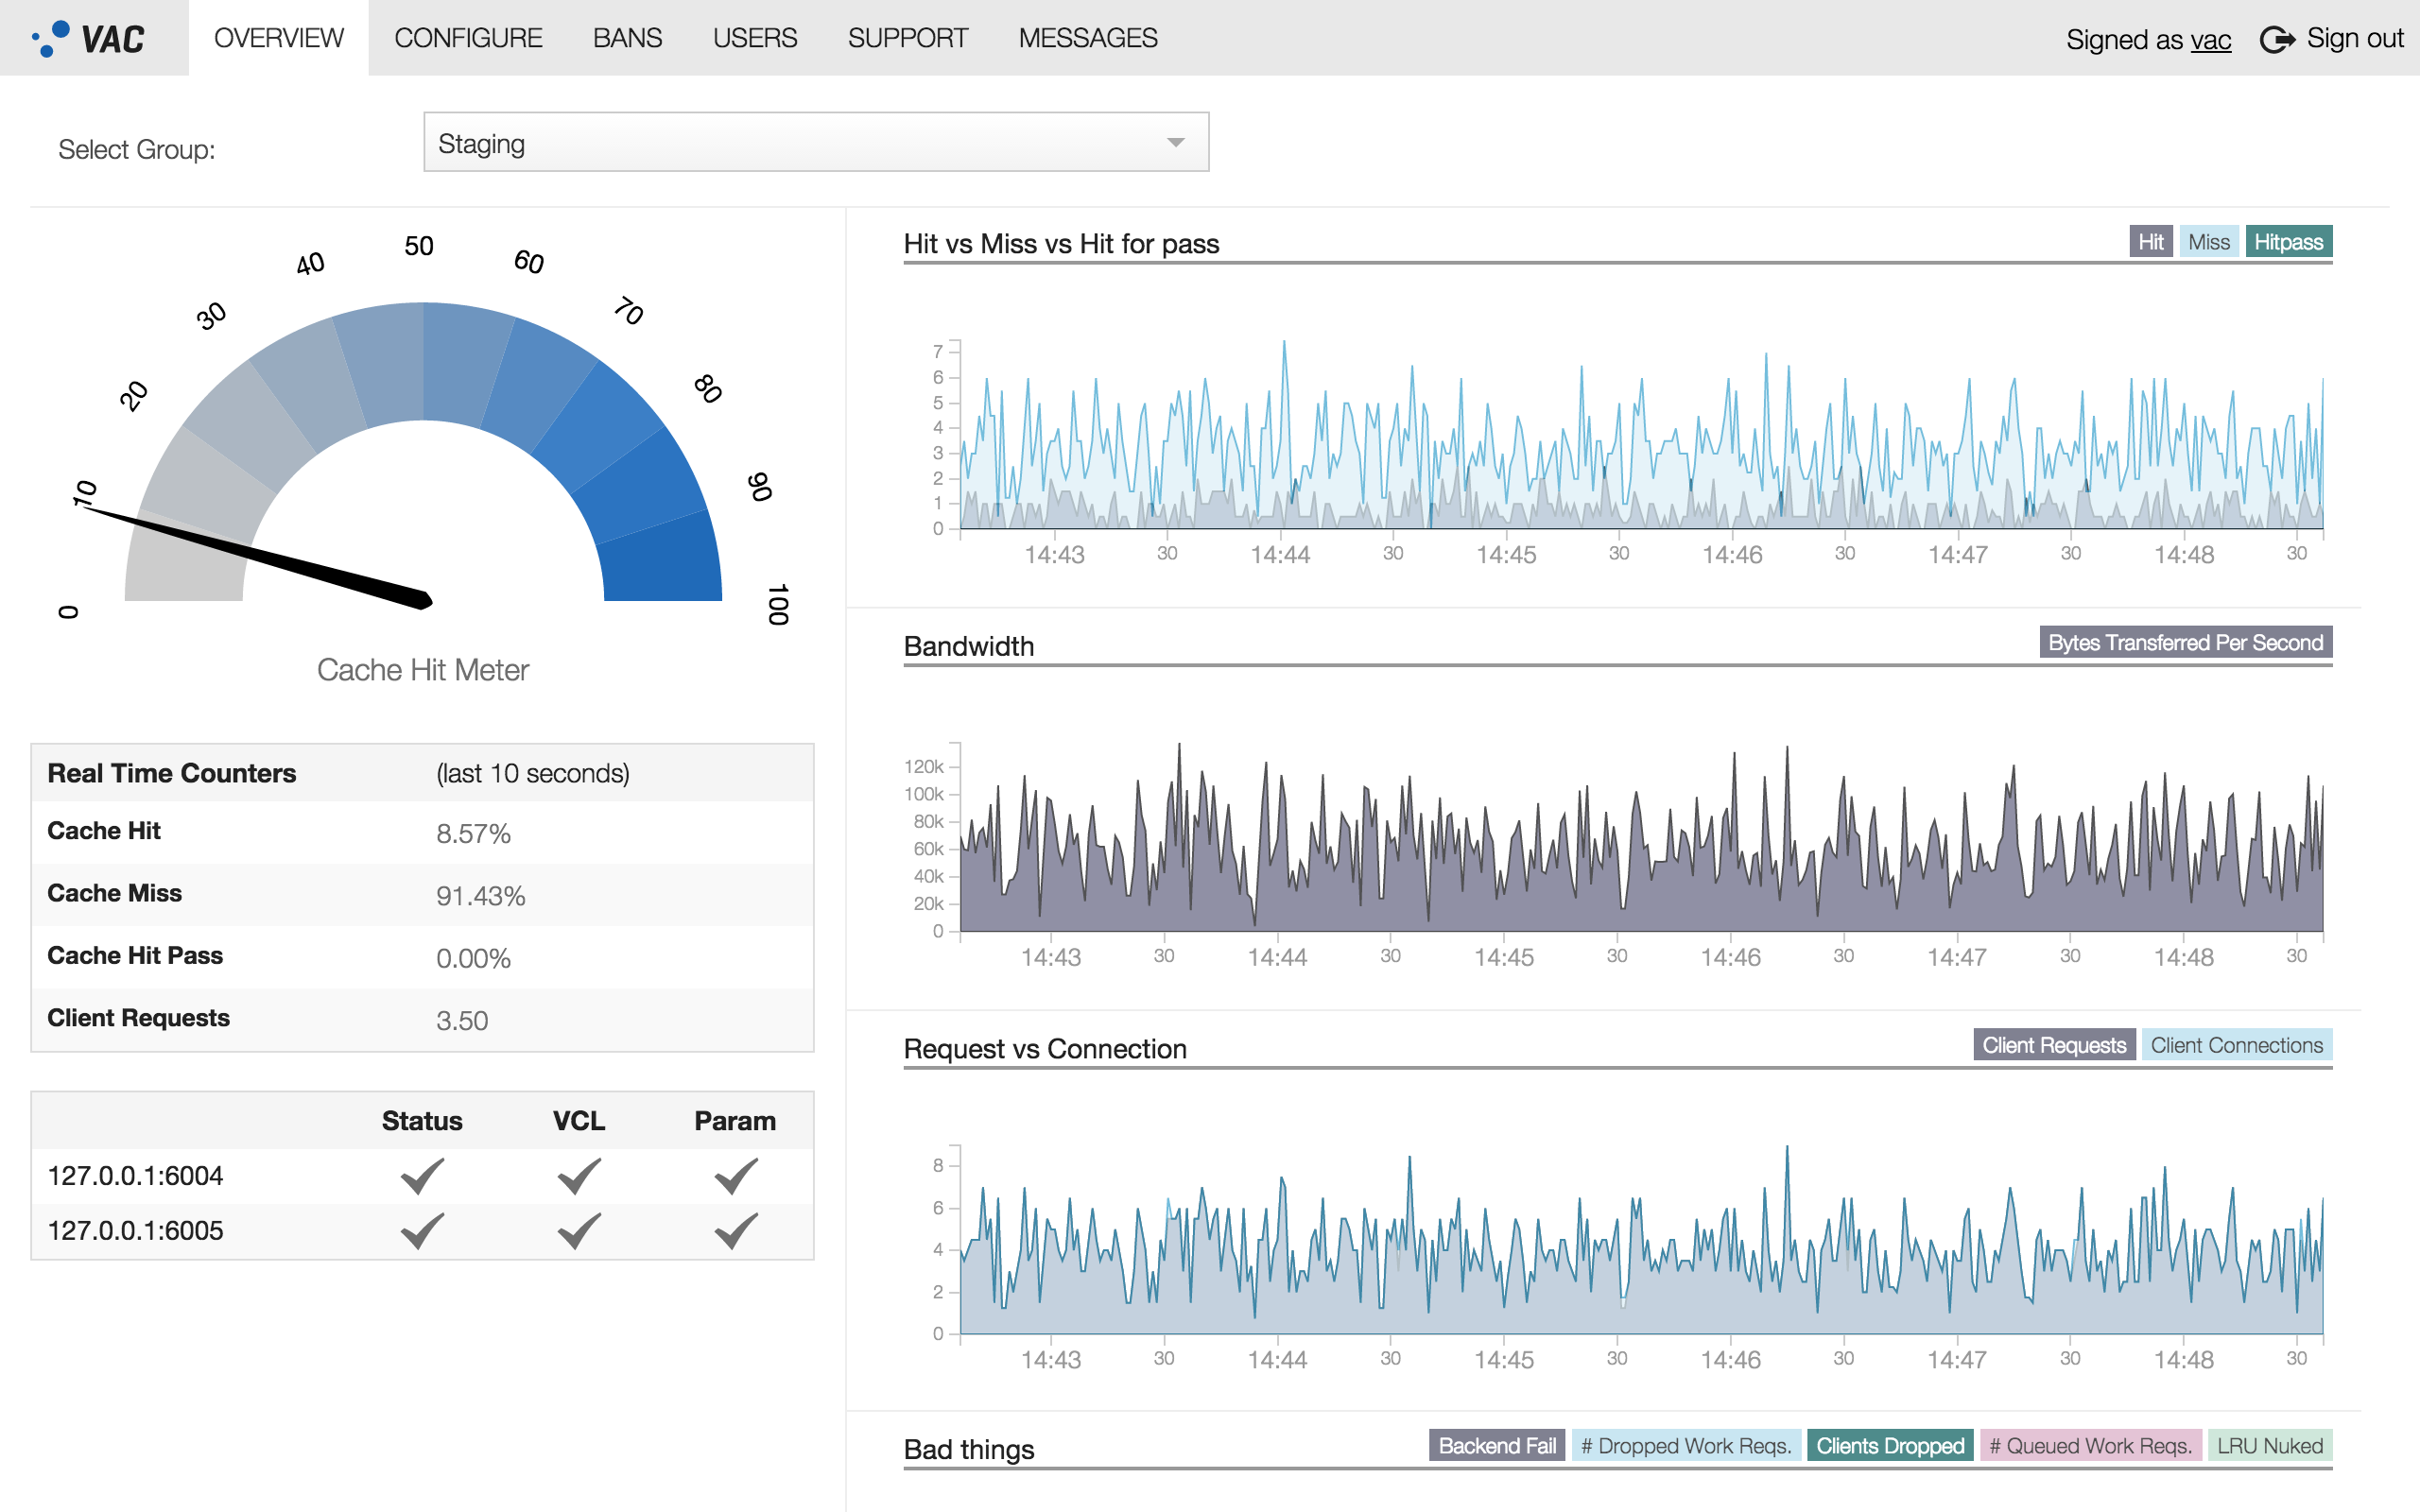
Fig. 28 Overview page of the Varnish Administration Console
Configuration Page of the Varnish Administration Console
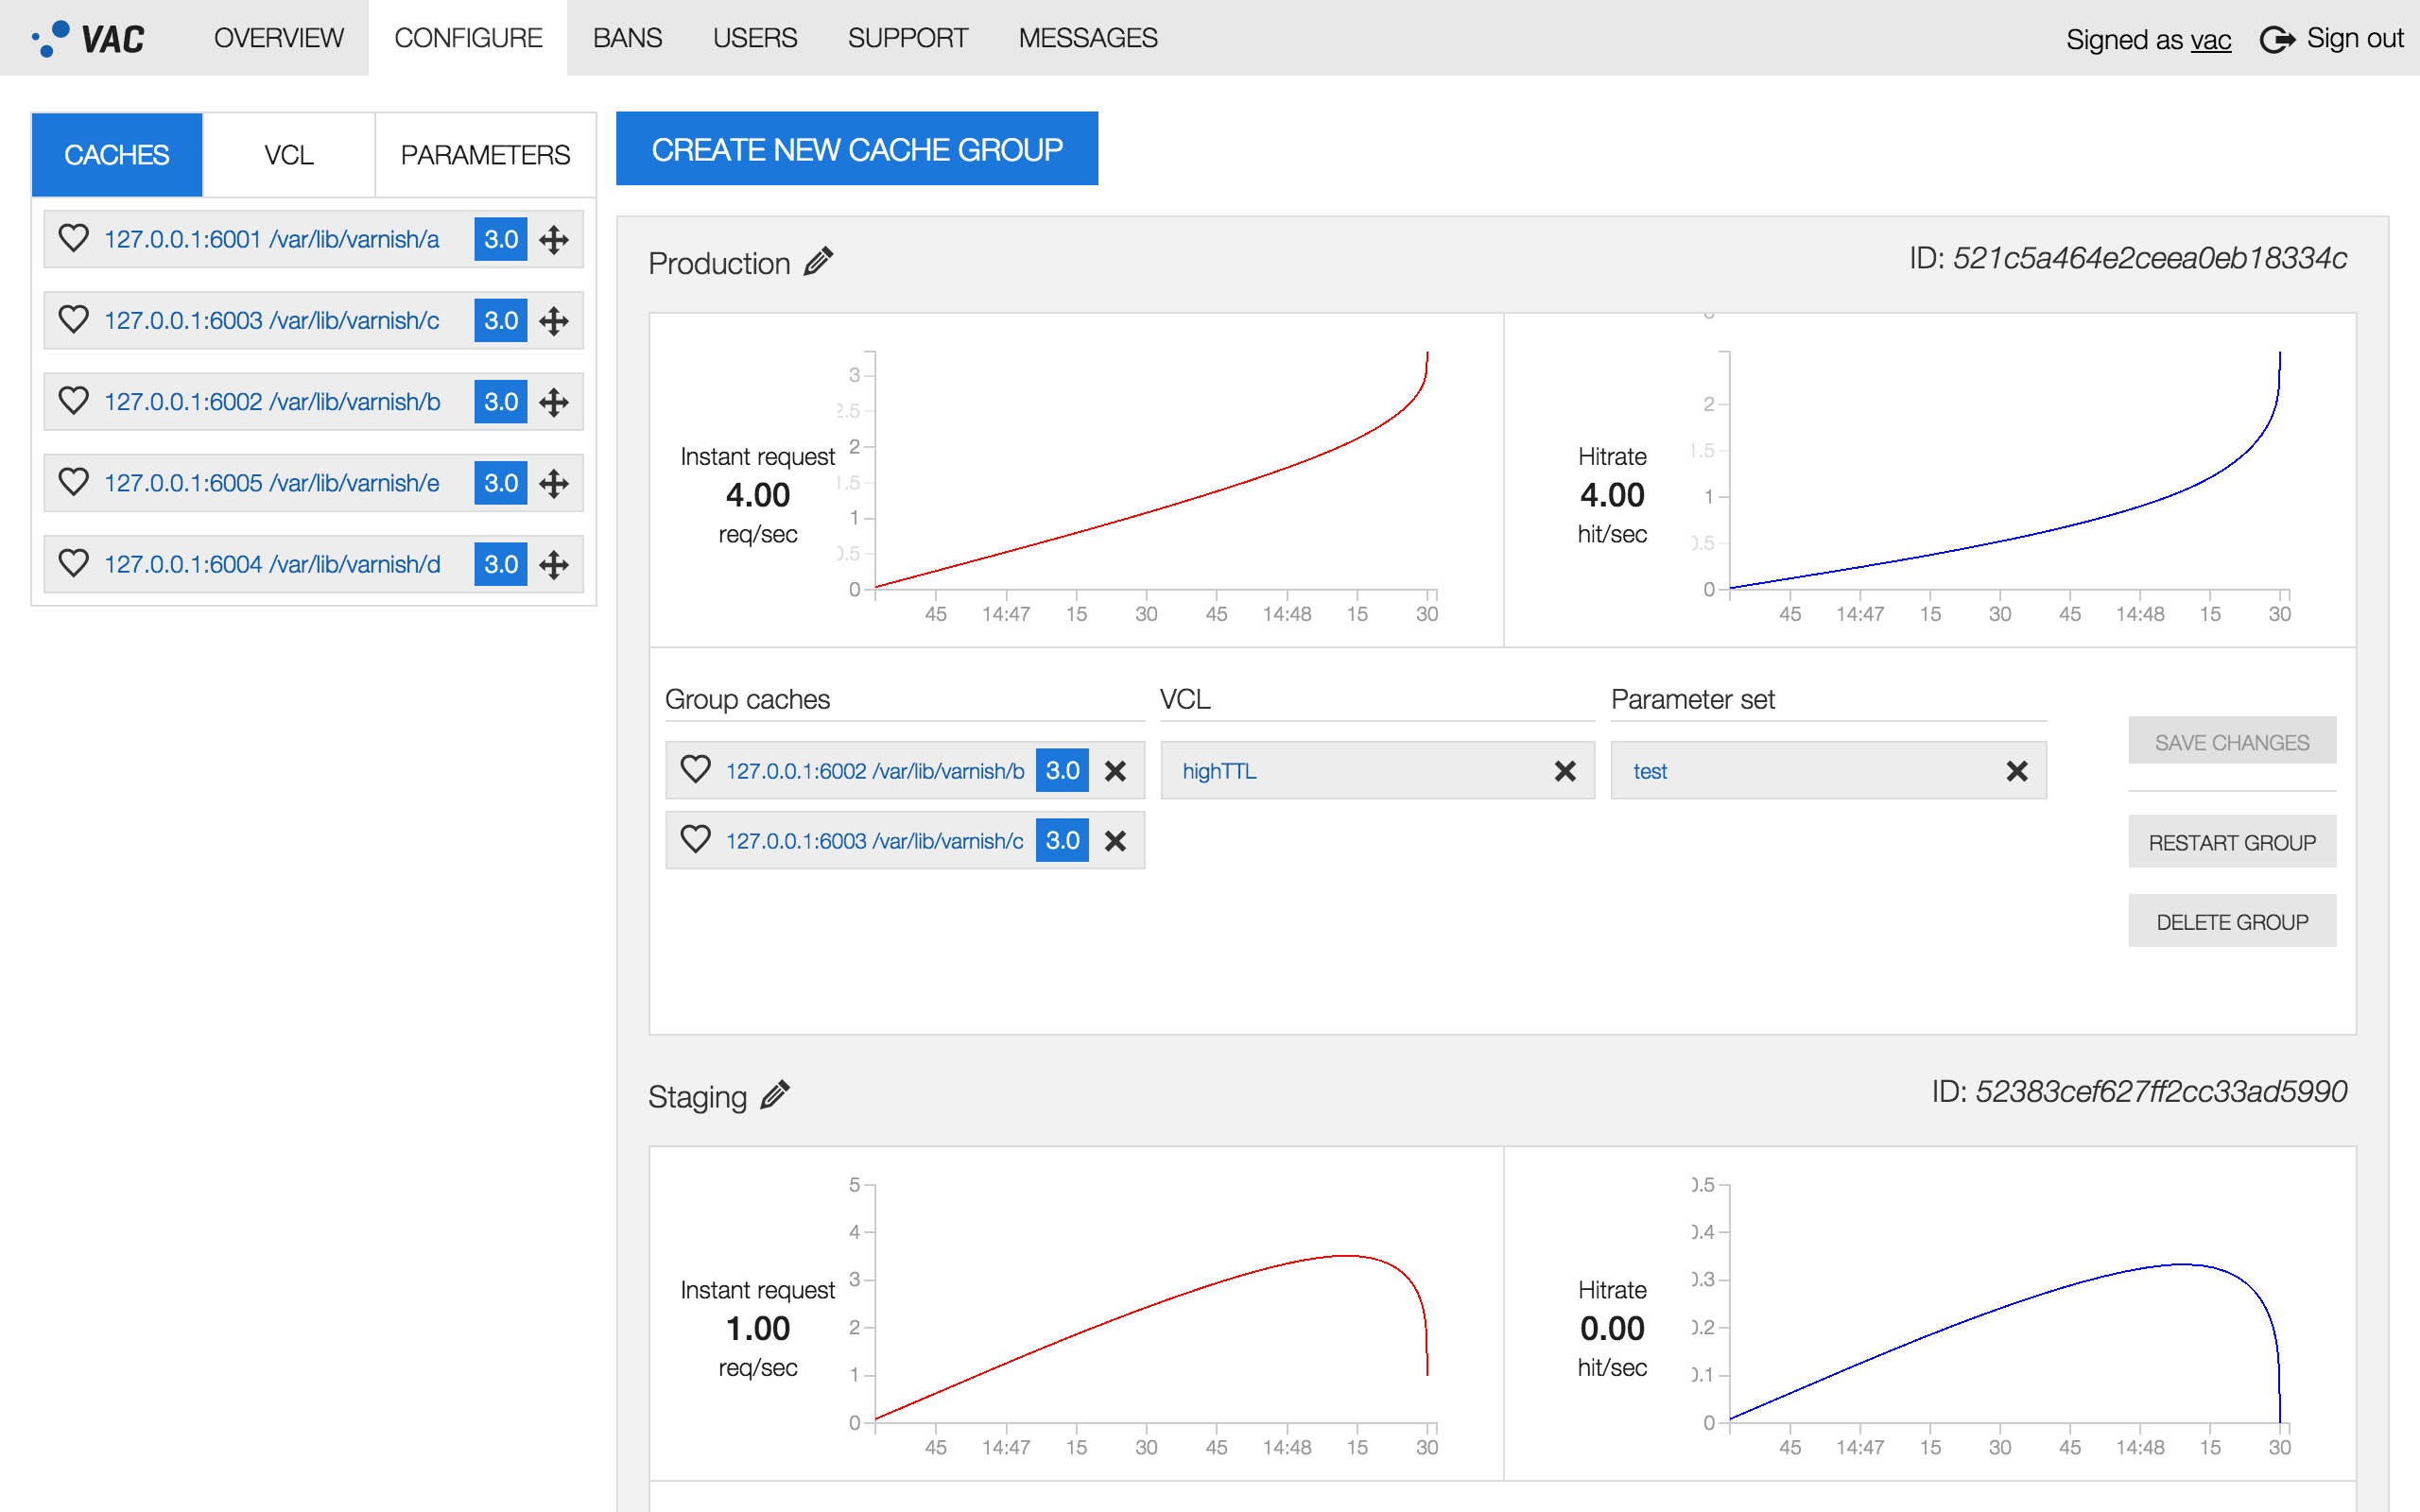
Fig. 29 Configuration page of the Varnish Administration Console
Banning Page of the Varnish Administration Console
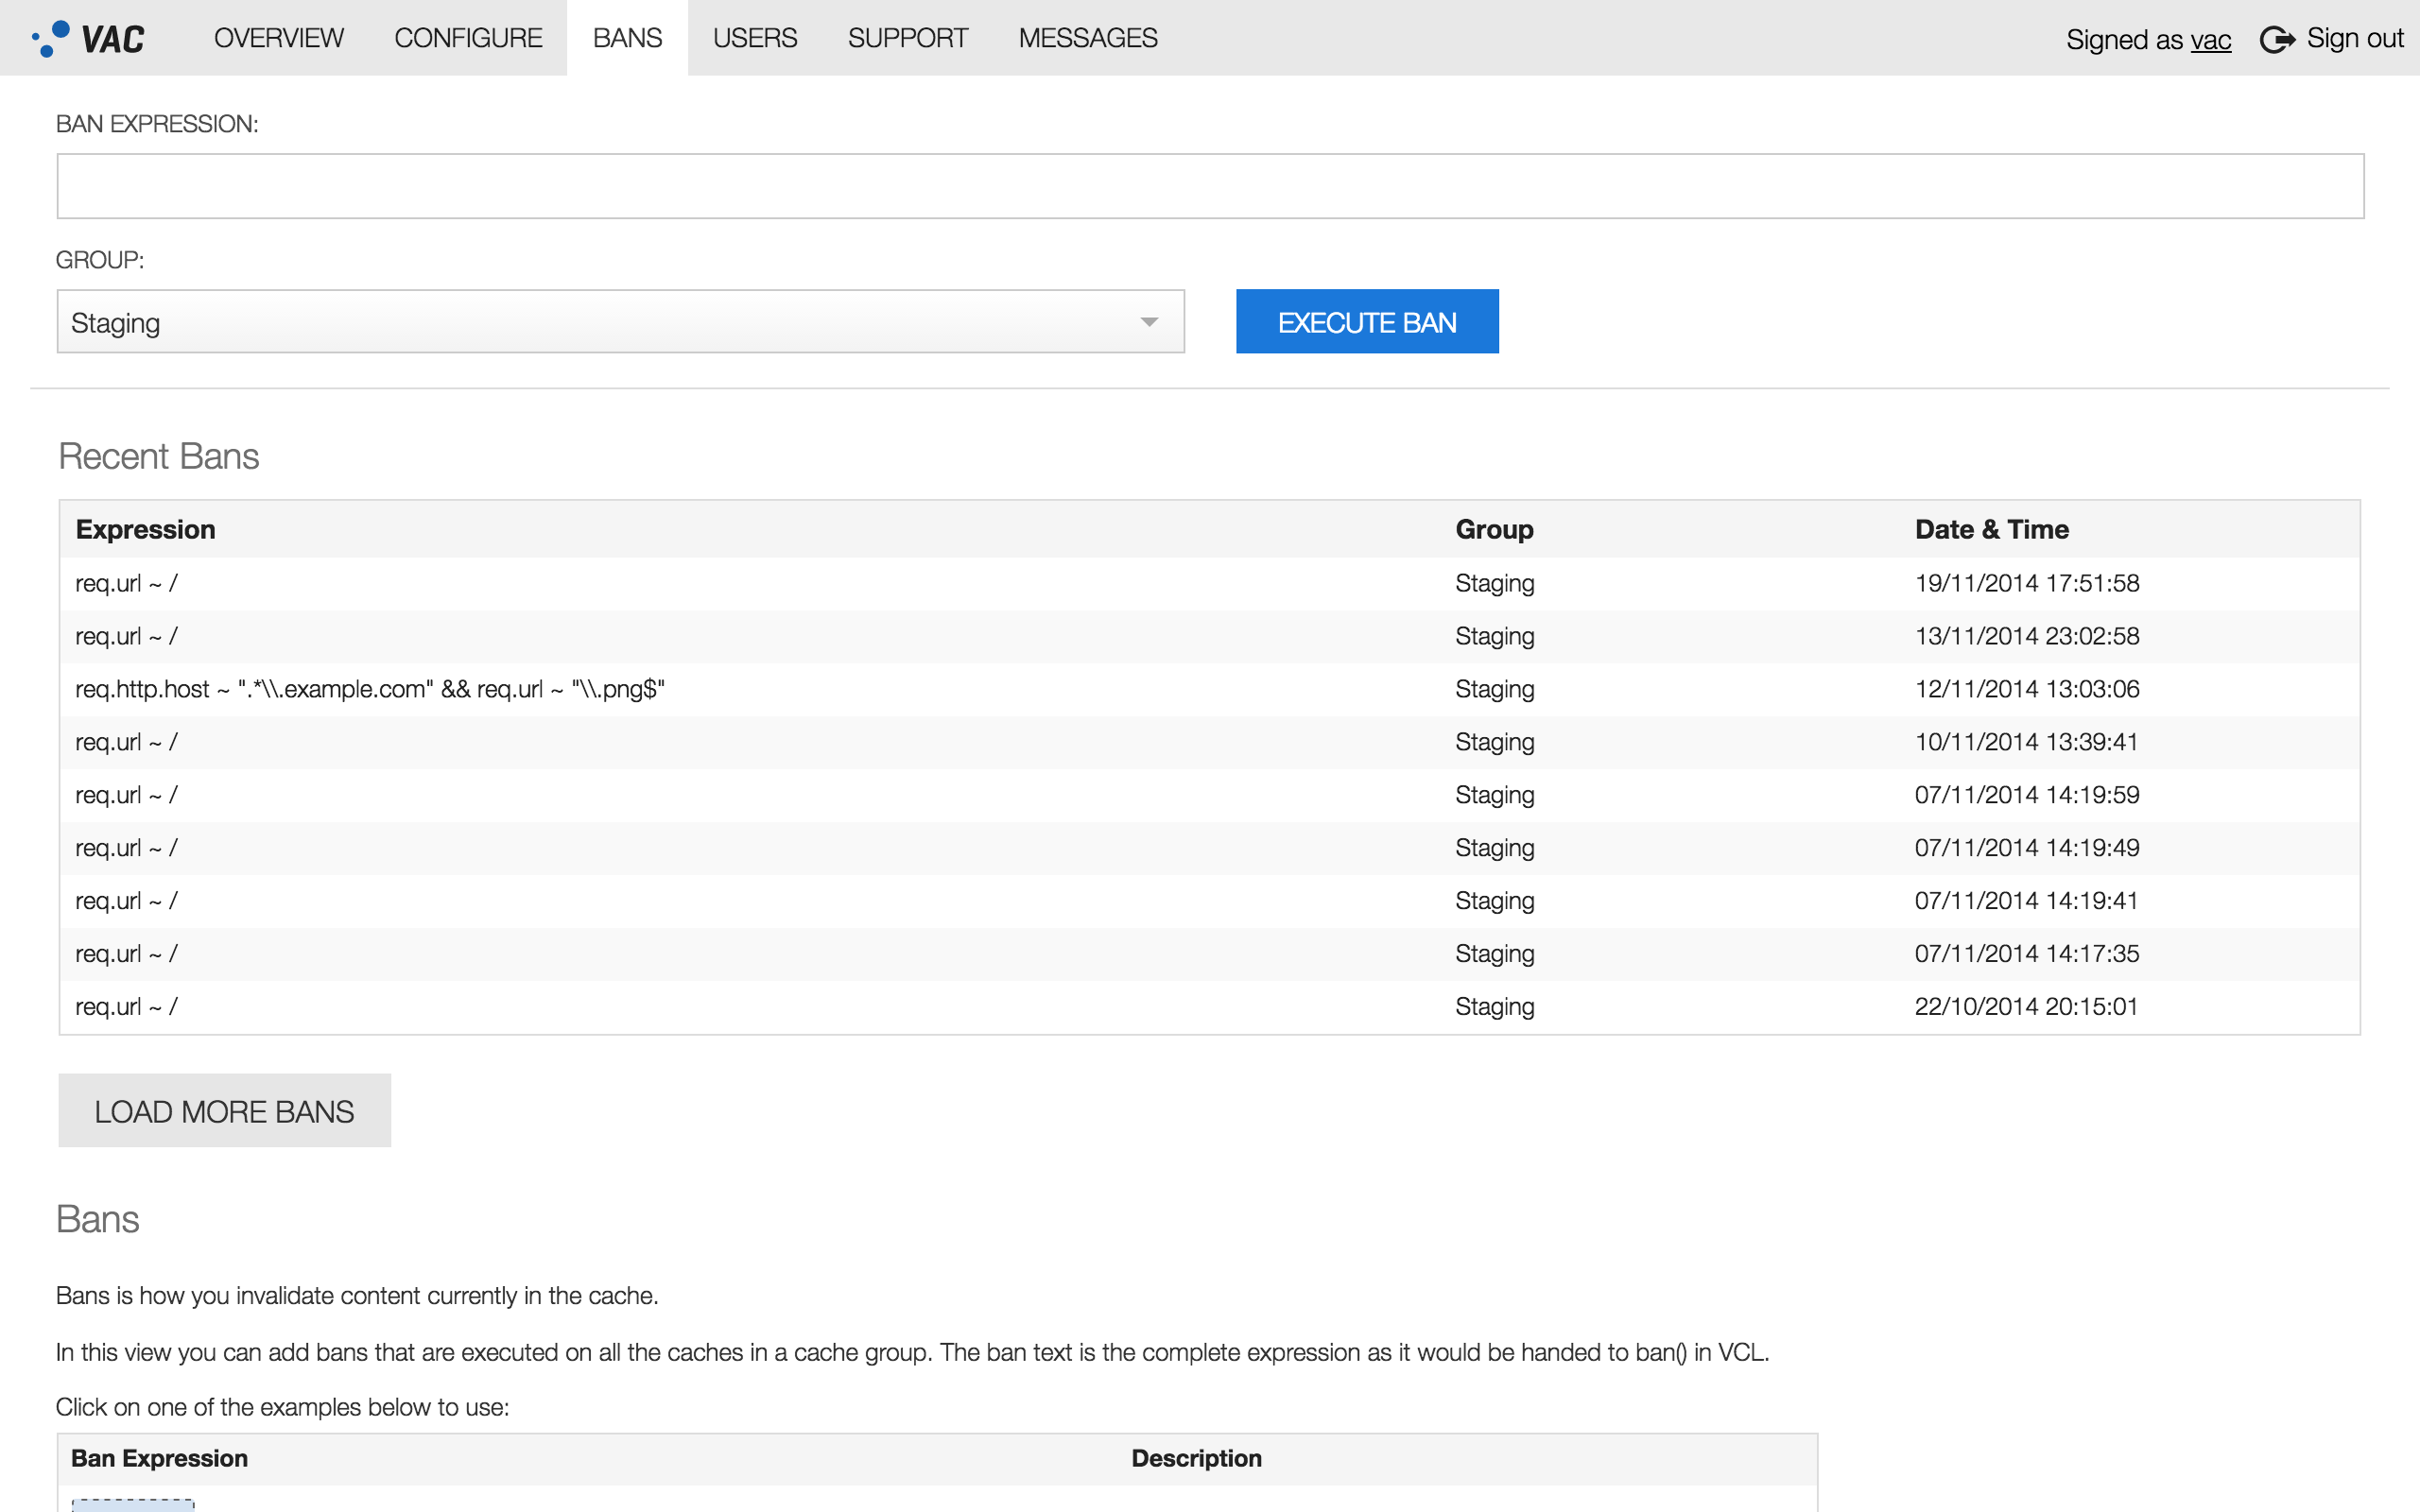
Fig. 30 Banning page of the Varnish Administration Console
Varnish Custom Statistics (VCS)
- Data stream management system (DSMS) for your Varnish servers
- Real-time statistics engine to aggregate, display and analyze user web traffic
- Provides an API to retrieve statistics
- Provides a GUI that presents lists and charts to get a quick overview of the key metrics that matters you

Fig. 31 VCS Data Flow
Varnish Custom Statistics (VCS) is our data stream management system (DSMS) implementation for Varnish.
VCS allows you to analyze the traffic from multiple Varnish servers in near real-time to compute traffic statistics and detect critical conditions.
This is possible by continuously extracting transactions with the vcs-key tags in your VSL.
Thus, VCS does not slow down your Varnish servers.
You can add as many custom vcs-key tags as you need in your VCL code.
This allows you to define your own metrics.
VCS can be used to produce statistical data or even apply complex event processing techniques. Thus, VCS offers endless opportunities for tracking all aspects of websites’ behavior. Typical cases include:
- A/B testing
- Measuring click-through rate
- Track slow pages and cache misses
- Analyze what is “hot” right now in a news website
- Track changes in currency conversions in e-commerce
- Track changes in Stock Keeping Units (SKUs) <behavior in e-commerce
- Track number of unique consumers of HLS/HDS/DASH video streams
VCS is a great tool when you want to test some functionality in your backend. For that, you can separate your requests into different groups, handle their requests accordingly, analyze the results and conclude whether your new functionality should be applied to all groups. This type of tests are called A/B testing. If you want to learn how to implement A/B testing in Varnish, please refer to https://info.varnish-software.com/blog/live-ab-testing-varnish-and-vcs.
Fig. 32 and Fig. 33 are screenshots of the VCS GUI. These screenshots are from the demo on http://vcsdemo.varnish-software.com. Your instructor can provide you credential for you to try the demo online.
Note
For further details on VCS, please look at its own documentation at https://www.varnish-software.com/resources/.
VCS Data Model
- Represents a finite relation from an infinite stream.
- Uses time-based tumbling windows
- API to query data model
- API outputs in JSON and JSONP format
| vcs-key | example.com | example.com |
|---|---|---|
| timestamp | 2013-09-18T09:58:00 | 2013-09-18T09:58:30 |
| n_req | 84 | 76 |
| n_req_uniq | NaN | NaN |
| n_miss | 0 | 1 |
| avg_restart | 0.000000 | 0.000000 |
| n_bodybytes | 12264 | 10950 |
| ttfb_miss | NaN | 0.000440 |
| ttb_hit | 0.000048 | 0.000054 |
| resp_1xx | 0 | 0 |
| resp_2xx | 84 | 76 |
| resp_3xx | 0 | 0 |
| resp_4xx | 0 | 0 |
| resp_5xx | 0 | 0 |
| reqbytes | 8 | 6 |
| respbytes | 32 | 29 |
| berespbytes | 30 | 27 |
| bereqbytes | 9 | 7 |
VCS uses the time-based tumbling windows technique to segment the data stream into finite parts.
These windows are created based on the vcs-key tag that you specify in your VCL code.
Each window aggregates the data within a configurable period of time.
Table 19 shows the data model in VCS.
This table is basically a representation of two windows seen as two records in a conventional database.
In this example, data shows two windows of 30 seconds based on the example.com vcs-key.
For presentation purposes in this page, the distribution of this table is of a database that grows from left to right.
The VCS data model has the following fields:
vcs-key- common key name for transactions making this record
timestamp- Timestamp at the start of the window
n_req- Number of requests
n_req_uniq- Number of unique requests, if configured
n_miss- Number of backend requests (i.e. cache misses)
Number of hits can be calculated as
n_hit = n_req - n_miss avg_restart- Average number of VCL restarts triggered per request
n_bodybytes- Total number of bytes transferred for the response bodies
ttfb_miss- Average time to first byte for requests that ended up with a backend request
ttb_hit- Average time to first byte for requests that were served directly from varnish cache
resp_1xx–resp_5xx- Counters for response status codes.
reqbytes- Number of bytes received from clients.
respbytes- Number of bytes transmitted to clients.
berespbytes- Number of bytes received from backends.
bereqbytes- Number of bytes transmitted to backends.
You can think of each window as a record of a traditional database that resides in memory. This database is dynamic, since the engine of VCS updates it every time a new window (record) is available. VCS provides an API to retrieve this data from the table above in JSON format:
{
 "example.com": [
     {
         "timestamp": "2013-09-18T09:58:30",
         "n_req": 76,
         "n_req_uniq": "NaN",
         "n_miss": 1,
         "avg_restarts": 0.000000,
         "n_bodybytes": 10950,
         "ttfb_miss": 0.000440,
         "ttfb_hit": 0.000054,
         "resp_1xx": 0,
         "resp_2xx": 76,
         "resp_3xx": 0,
         "resp_4xx": 0,
         "resp_5xx": 0,
         ...
     },
     {
         "timestamp": "2013-09-18T09:58:00",
         "n_req": 84,
         "n_req_uniq": "NaN",
         "n_miss": 0,
         "avg_restarts": 0.000000,
         "n_bodybytes": 12264,
         "ttfb_miss": "NaN",
         "ttfb_hit": 0.000048,
         "resp_1xx": 0,
         "resp_2xx": 84,
         "resp_3xx": 0,
         "resp_4xx": 0,
         "resp_5xx": 0,
         ...
     },

     ...
     ]
}
VCS API
- API provides ready-to-use queries
- Queries over HTTP
- Top-most sorting
- Results in JSON and JSONP format
Examples:
For vcs-key with names ending with .gif, retrieve a list of the top 10:
/match/(.*)%5C.gif$/top
Find a list of the top 50 slowest backend requests:
/all/top_ttfb/50
The VCS API queries the VCS data model and the output is in JSON format. The API responds to requests for the following URLs:
/key/<vcs-key>- Retrieves stats for a single
vcs-key.<vcs-key>name must be URL encoded. /match/<regex>- Retrieves a list of
vcs-keymatching the URL encoded regular-expression. Accepts the query parameterverbose=1, which displays all stats collected for the<vcs-keys>matched. /all- Retrieves a list of all the
<vcs-keys>currently in the data model.
For /match/<regex> and /all, VCS can produce sorted lists.
For that, you can append one of the following sorting commands.
/top- Sort based on number of requests.
/top_ttfb- Sort based on the
ttfb_missfield. /top_size- Sort based on the
n_bodybytesfield. /top_miss- Sort based on the
n_missfield. /top_respbytes- Sort based on number of bytes transmitted to clients.
/top_reqbytes- Sort based on number of bytes received from clients.
/top_berespbytes- Sort based on number of bytes fetched from backends.
/top_bereqbytes- Sort based on number of bytes transmitted to backends.
/top_restarts- Sort based on the
avg_restartsfield. /top_5xx,/top_4xx, ...,/top_1xx- Sort based on number of HTTP response codes returned to clients for 5xx, 4xx, 3xx, etc.
/top_uniq- Sort based on the
n_req_uniqfield.
Further, a /k parameter can be appended, which specifies the number of keys to include in the top list.
If no k value is provided, the top 10 is displayed.
Note
For installation instructions, please refer to http://files.varnish-software.com/pdfs/installation-guide_vcs-latest.pdf.
Once you have installed all necessary components, take a look at the man pages of vstatd and vstatdprobe for more documentation.
Screenshots of GUI
- VCS provides its own GUI
- You can interact with the API via this GUI
- Screenshots from http://vcsdemo.varnish-software.com/
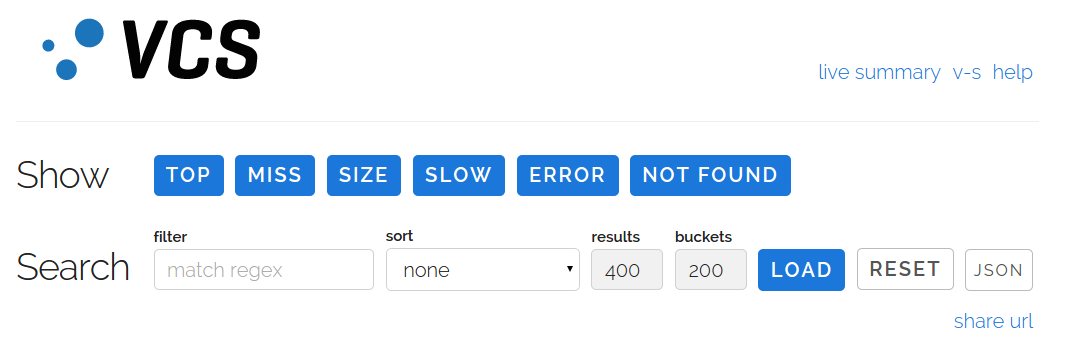
Fig. 32 Header of Varnish Custom Statistics
Fig. 33 Summary of metrics with time based graphs
Varnish High Availability (VHA)
- Content replicator
- Increases resiliency and performance
- Two-server, circular, multi-master replication
- Requests to replicate content against Varnish servers, not the backend

Fig. 34 VHA Sequence Diagram
The Varnish High Availability agent (vha-agent) is a content replicator with the aim of copying the cached objects from an origin Varnish server to a neighboring Varnish server. This increases resiliency and performance, specially when backend traffic surges.
vha-agent reads the log of Varnish, and for each object insertion detected it fires a request to the neighboring Varnish server. This server fetches the object from the origin Varnish server. As a result, the same object is cached in both servers with only one single backend fetch.
This solution requires vha-agent to be installed on the origin Varnish server, and some simple VCL configuration on the replicated Varnish server. Ideally, vha-agent is installed on both servers so they can both replicate object insertions from each other in an active/active configuration.
Typical uses of VHA include:
- Business critical Varnish installations
- Any multi-cache Varnish setup
- Multi node CDN POP installations
The replication of cached objects may bring the need for multiple cache invalidation. For that purpose, you can use the Varnish Administration Console (VAC). Remember: you should define the rules on how to invalidate cached objects before caching them in production environments.
SSL/TLS frontend support with hitch
- Varnish supports SSL/TLS encryption
- Backend encryption in Varnish Cache Plus
- Client encryption in Varnish Cache Plus 4.1 with hitch
- Hitch: network proxy that terminates SSL/TLS connections and forwards the unencrypted traffic
- Configuration file:
/etc/hitch/hitch.conf - Configure Varnish to listen to
PROXYrequests in/etc/varnish/varnish.params
Backend encryption is useful for deployments with geographically distributed origin servers such as CDNs. Varnish supports SSL/TLS encryption to secure communication on both: backend and frontend without third-party solutions. SSL/TLS configuration for connections between Varnish and the backend is described in Exercise: Configure Varnish.
Varnish Plus integrates hitch, which can have tens of thousands of listening sockets and hundreds of thousands of certificates. Following are the steps to configure Varnish to accept SSL/TLS connections with hitch.
Configure your package repository as explained in Solution: Install Varnish.
Install hitch in RedHat systems:
$ yum install varnish-plus-addon-ssl
or Ubuntu based systems:
$ apt-get install varnish-plus-addon-ssl
Create a key
.pemfile:$ /etc/pki/tls/certs/make-dummy-cert your-cdn.pem
For the purposes of this book, we create a dummy key and certification file concatenated in the
.pemfile. See https://docs.varnish-software.com/tutorials/hitch-letsencrypt/ or https://github.com/varnish/hitch/blob/master/docs/certificates.md for alternative methods.Configure hitch in
/etc/hitch/hitch.conf:frontend = "[*]:443" backend = "[127.0.0.1]:6081" pem-file = "/path/to/your-cdn.pem" ciphers = "EECDH+AESGCM:EDH+AESGCM:AES256+EECDH:AES256+EDH" prefer-server-ciphers = off ssl-engine = "" workers = 1 backlog = 100 keepalive = 3600 chroot = "" user = "hitch" group = "hitch" quiet = off syslog = on syslog-facility = "daemon" daemon = on write-ip = off write-proxy-v1 = on write-proxy-v2 = off proxy-proxy = off sni-nomatch-abort = off
If your server is behind a firewall, ensure it can accept HTTPS connections.
In
/etc/varnish/varnish.params, configure Varnish Plus to listen toPROXYrequests on port6081:DAEMON_OPTS="-a :6081,PROXY"
Start hitch:
$ service hitch start
At the moment of writing this text,
service hitch startdid not output starting errors. You should check whether hitch has started, if not, try the following command to debug:$ /usr/sbin/hitch --pidfile=/run/hitch/hitch.pid \ --config=/etc/hitch/hitch.conf
Note
Hitch has its own documentation in its man pages man hitch and man hitch.conf.
Additional information at https://github.com/varnish/hitch.