Live Activity Monitoring
This article describes how to configure and use runtime monitoring services in NGINX Plus: the interactive Dashboard, NGINX Plus REST API, and NGINX Amplify.
- About Live Activity Monitoring
- Prerequisites
- Gathering Data to Appear in Statistics
- Configuring the API
- Using the Dashboard
- Using the REST API
- Monitoring NGINX with Amplify
About Live Activity Monitoring
NGINX Plus provides various monitoring tools for your server infrastructure:
the interactive Dashboard page available since NGINX Plus R9 - a real-time live activity monitoring interface that shows key load and performance metrics of your server infrastructure.
NGINX REST API available since NGINX Plus R14 - an interface that can obtain extended status information, reset statistics, manage upstream servers on-the-fly, and manage key-value store. With the API you can connect NGINX Plus status information with third-party tools that support the JSON interface, for example, NewRelic or your own dashboard.
NGINX Amplify - a SAAS tool for comprehensive monitoring of your server infrastructure including NGINX Plus (status metrics, log files, processes state); system metrics (CPU and memory usage), operating system metadata (uptime, hostname).
Note: Prior to NGINX Plus R14, gathering statistics and management of upstream servers in the Dashboard was performed with the
statusandupstream_confmodules. Now the extendedstatusandupstream_confmodules are superseded by theapimodule. Starting from R16, thestatusandupstream_confmodules will be removed and completely superseded with theapimodule.
Prerequisites
- NGINX Plus R13 and later for NGINX Plus REST API and the Dashboard
- Data for statistics (see Gathering Data to Appear in Statistics)
Gathering Data to Appear in Statistics
In order to collect data from virtual servers, upstream server groups, or cache zones, you will need to enable shared memory zones for the objects you want to collect data for. A shared memory zone stores configuration and runtime state information referenced by NGINX worker processes.
To make HTTP and TCP server to appear in statistics, specify the
status_zonedirective. The same zone name can be specified more than once for manyserverblocks, so that the statistics for these servers will be aggregated together in the Dashboard:server { # ... status_zone status_page; location / { proxy_pass http://backend; } }
To make an upstream server group to appear in statistics, specify the
zonedirective per eachupstreamblock:upstream backend { zone backend 64k; server backend1.example.com; server backend2.example.com; }
To make cache appear in statistics, make sure that caching is enabled in your configuration. A shared memory zone for caching is specified in the
proxy_cache_path,fastcgi_cache_path,scgi_cache_path, oruwsgi_cache_pathdirective in thekeys_zoneparameter. See NGINX Content Caching for more information:http { # ... proxy_cache_path /data/nginx/cache keys_zone=one:10m; }
To make health checks appear in statistics, make sure that health checks are enabled with the
health_checkdirective and the server group resides in the shared memory. See HTTP Health Checks and TCP Health Checks for more information:server { # ... status_zone status_page; location / { proxy_pass http://backend; health_check; } }
When finished, save and exit configuration file.
Test the configuration and reload NGINX Plus:
sudo nginx -t && sudo nginx -s reload
Configuring the API
To enable the API:
In the
httpcontext, specify aserverblock that will be responsible for the API:http { server { # your api configuration will be here } }
Create a
locationfor API requests and specify theapidirective in this location:http { # ... server { listen 192.168.1.23; # ... location /api { api; # ... } } }
In order to make changes with the API, such as resetting statistics counters, managing upstream servers on-the-fly or key-value storage, managing upstream servers from the Dashboard, enable the read-write mode for the API by specifying the
write=onparameter for theapidirective:http { # ... server { listen 192.168.1.23; # ... location /api { api write=on; # ... } } }
It is recommended restricting access to this location, for example, allow access only from local networks with
allowanddenydirectives:http { # ... server { listen 192.168.1.23; # ... location /api { api write=on; allow 192.168.1.0/24; deny all; } } }
When the API is enabled in the write mode, it is recommended restricting access to
PATCH,POST, andDELETEmethods to particular users. This can be done by implementingHTTP basic authentication:http { ... server { listen 192.168.1.23; # ... location /api { limit_except GET { auth_basic "NGINX Plus API"; auth_basic_user_file /path/to/passwd/file; } api write=on; allow 192.168.1.0/24; deny all; } } }
Enable the Dashboard by specifying the
/dashboard.htmllocation. By default the Dashboard is located in the root directory (for example,/usr/share/nginx/html) specified by the root directive:http { ... server { listen 192.168.1.23; # ... location /api { limit_except GET { auth_basic "NGINX Plus API"; auth_basic_user_file /path/to/passwd/file; } api write=on; allow 192.168.1.0/24; deny all; } location = /dashboard.html { root /usr/share/nginx/html; } } }
Enable the Swagger UI by creating a
locationfor it, for example, /swagger-ui. By default Swagger UI is located in the root directory specified by therootdirective, for example, /usr/share/nginx/html:http { # ... server { listen 192.168.1.23; # ... location /api { limit_except GET { auth_basic "NGINX Plus API"; auth_basic_user_file /path/to/passwd/file; } api write=on; allow 192.168.1.0/24; deny all; } location = /dashboard.html { root /usr/share/nginx/html; } location /swagger-ui { root /usr/share/nginx/html; } } }
Using the Dashboard
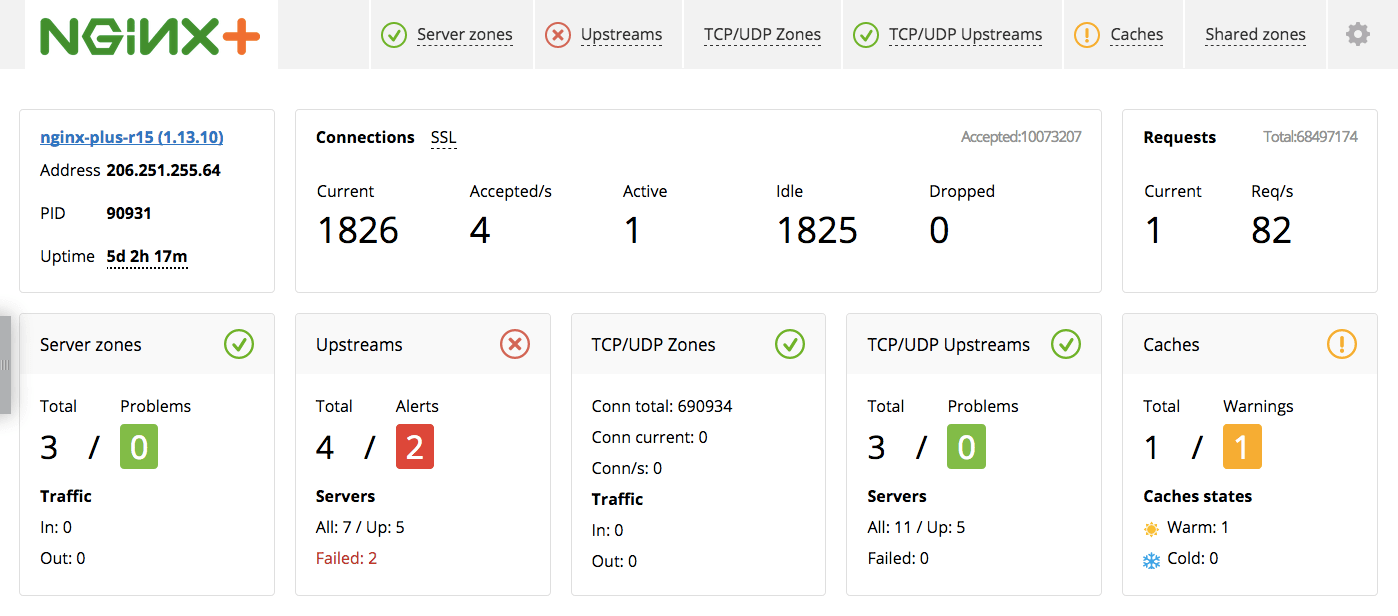
NGINX Plus Dashboard provides a real-time live activity monitoring interface that shows key load and performance metrics of your server infrastructure.
Accessing the Dashboard
In the address bar of your browser, type-in the address that corresponds to your Dashboard page (in our example http://192.168.1.23/dashboard.html). This will display the Dashboard page located at /usr/share/nginx/html as specified in the root directive.
There is also a live demo page from NGINX available at demo.nginx.com/dashboard.html:
Tabs Overview
All information in NGINX Plus Dashboard is represented in tabs.

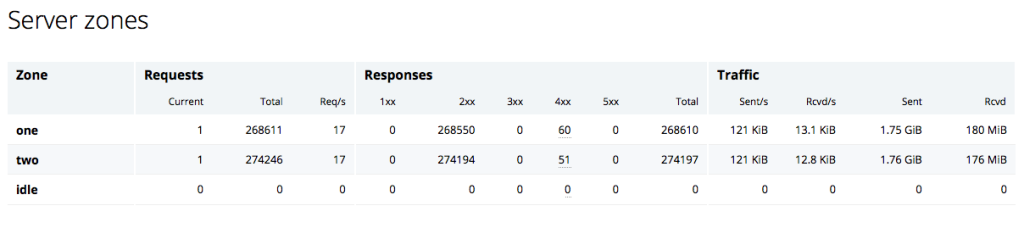
The Server Zones tab gives detailed statistics on the frontend performance. Statistics are shown per each server in the http context. For NGINX Plus to collect information for each server, you must include the status_zone directive in each server configuration block.
The Upstreams tab provides information about each upstream group for HTTP and HTTPS traffic. TCP and UDP upstream groups appear on the TCP/UDP Upstreams tab. For NGINX Plus to collect information for an upstream group, you must include the zone directive in the upstream configuration block.

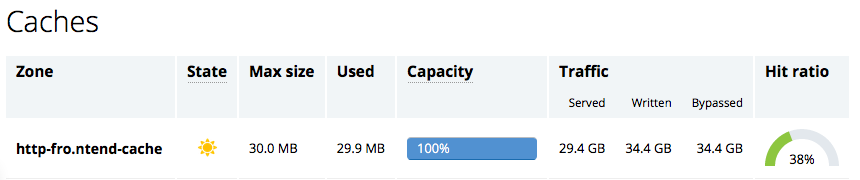
The Caches tab provides statistics about the caches configured in NGINX Plus. For NGINX Plus to collect information for an upstream group, you must configure cache.
Managing Upstream Servers from the Dashboard
You can add new or modify and remove upstream servers directly from the Dashboard interface. Note that you must previously enable the api in the write mode.
In the Upstreams or TCP/UDP Upstreams tab, click the pencil icon next to the server name and choose between Edit selected and Add server buttons:
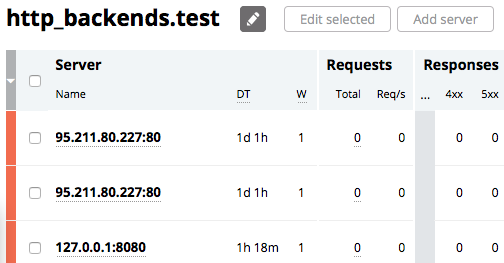
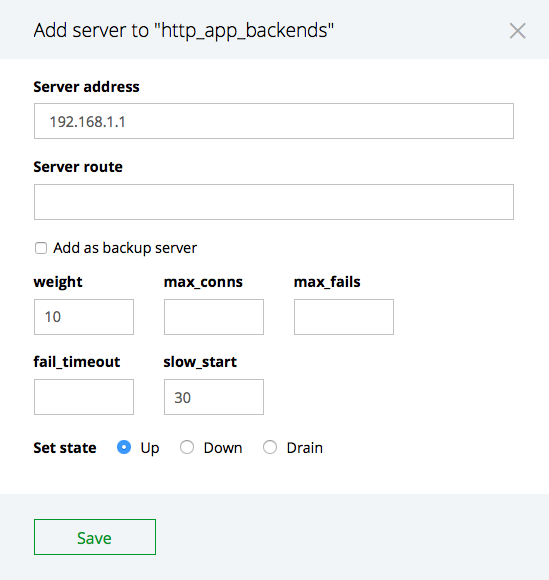
To add an upstream server, click Add server:
To remove or modify an upstream server, click the box to the left of each server’s name, then click Edit selected:
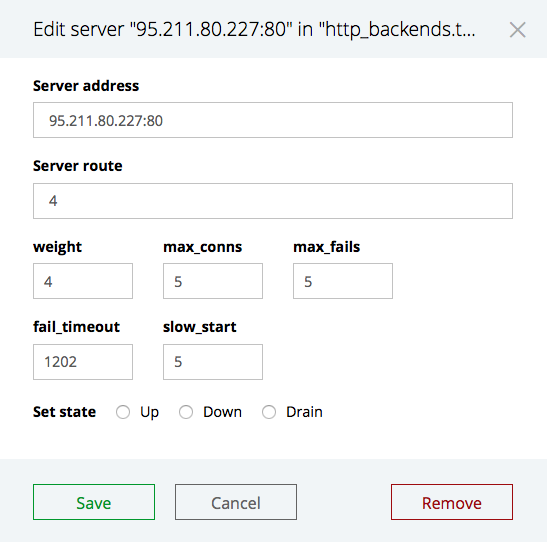
When finished, click the Save button to save the changes.
Using the REST API
With NGINX Plus, statistics of your server infrastructure can be managed with the REST API interface. The API is based on standard HTTP requests: statistics can be obtained with GET requests and reset with DELETE requests. Upstream servers can be added with POST requests and modified with PATCH requests. See Managing Upstream Servers with the API for more information.
The requests are sent in the JSON format that allows you to connect the stats to monitoring tools or dashboards that support JSON.
Getting statistics with the API
The status information of any element can be accessed with a slash-separated URL. The URL may look as follows:
http://demo.nginx.com/api/3/http/caches/http_cache?fields=expired,bypass
where:
/apiis the location you have configured in the NGINX configuration file for the API/3is the API version, the current API version is3/http/caches/http_cacheis the path to the resource?fields=expired,bypassis an optional argument that specifies which fields of the requested object will be output
The requested information is returned in the JSON data format.
To get the list of all available rootpoints, send the GET request with the ‘curl’ command in terminal (in the example, JSON pretty print extension “json_pp” is used):
curl -s 'https://demo.nginx.com/api/3/' | json_pp
The JSON data returned:
[
   "nginx",
   "processes",
   "connections",
   "ssl",
   "slabs",
   "http",
   "stream"
]
To get the statistics for a particular endpoint, for example, obtain general information about NGINX, send the following GET request:
curl -s 'https://demo.nginx.com/api/3/nginx' | json_pp
The JSON data returned:
    {
       "version" : "1.13.10",
       "build" : "nginx-plus-r15",
       "generation" : 13,
       "timestamp" : "2018-04-19T11:49:40.211Z",
       "pid" : 578,
       "ppid" : 90931,
       "address" : "206.251.255.64",
       "load_timestamp" : "2018-04-14T10:00:00.358Z"
    }
You can specify which fields of the requested object will be output with the optional fields argument in the request line. For example, to display only NGINX Plus version and build, specify the command:
curl -s 'https://demo.nginx.com/api/3/nginx?fields=version,build' | json_pp
The JSON data returned:
{
   "version" : "1.13.10",
   "build" : "nginx-plus-r15"
}
For a complete list of available endpoints and supported methods see reference documentation.
Resetting the statistics
Resetting the statistics is performed by sending an API command with the DELETE method to a target endpoint. Make sure that your API is configured in the read-write mode.
You can reset the following types of statistics:
- abnormally terminated and respawned child processes
- accepted and dropped client connections
- SSL handshakes and session reuses
- the
reqsandfailsmetrics for each memory slot - total client HTTP requests
- accepted and discarded requests, responses, received and sent bytes in a particular HTTP server zone
- cache hits and cache misses in a particular cache zone
- statistics for a particular http or stream upstream server in an upstream server group
For example, to reset the number of abnormally terminated and respawned child processes, you can perform the following command in the terminal via curl:
curl -X DELETE -s 'http://192.168.1.23/api/3/processes'
To reset accepted and dropped client connections perform the following command:
curl -X DELETE -s 'http://192.168.1.23/api/3/connections'
Managing Upstream Servers with the API
The NGINX Plus REST API supports POST and PATCH HTTP methods to dynamically add a server to the upstream group or modify server parameters.
To dynamically change the configuration of an upstream group, send an HTTP request with the appropriate API method. The following examples use the curl command, but any mechanism for making HTTP requests is supported. All request bodies and responses are in JSON format.
The URI specifies the following information in this order:
- The hostname or IP address of the node that handles the request (in the following examples, 192.168.1.23)
- The location where the
apidirective appears (api) - The API version (3)
- The name of the upstream group, complete its place in the NGINX Plus configuration hierarchy represented as a slash-separated path (http/upstreams/appservers)
For example, to add a new server to the appservers upstream group, send the following curl command:
curl -X POST -d '{ \
   "server": "10.0.0.1:8089", \
   "weight": 4, \
   "max_conns": 0, \
   "max_fails": 0, \
   "fail_timeout": "10s", \
   "slow_start": "10s", \
   "backup": true, \
   "down": true \
 }' -s 'http://192.168.1.23/api/3/http/upstreams/appservers/servers'
To remove a server from the upstream group:
curl -X DELETE -s 'http://192.168.1.23/api/3/http/upstreams/appservers/servers/0'
To set the down parameter for the first server in the group (with ID 0):
curl -X PATCH -d '{ "down": true }' -s 'http://192.168.1.23/api/3/http/upstreams/appservers/servers/0'
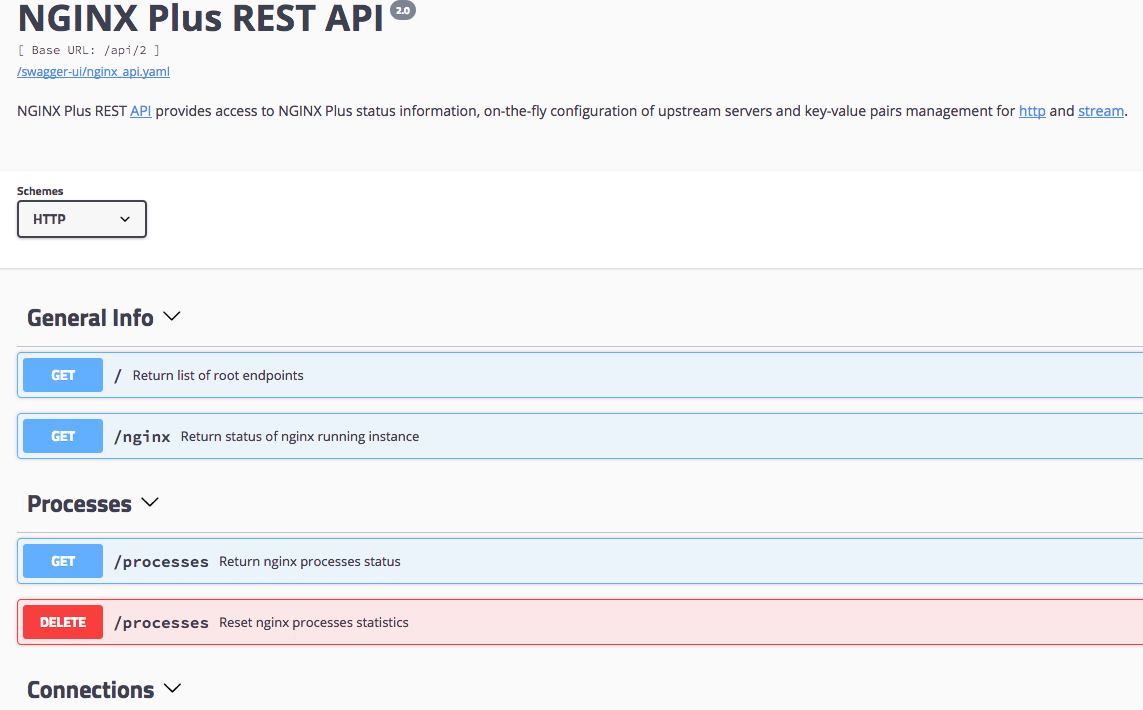
The Swagger UI
NGINX Plus contains an integrated Swagger UI page that allows you to explore the REST API documentation and send API commands with the graphical user interface.
Using the Swagger UI
To access the Swagger UI page:
- In the address bar of your browser, type-in the address of Swagger UI, in our example the address is http://192.168.1.23/swagger-ui/:
- If you have configured the HTTPS protocol for the Swagger UI page, you will need to choose the “HTTPS” scheme in the “Schemes” menu.
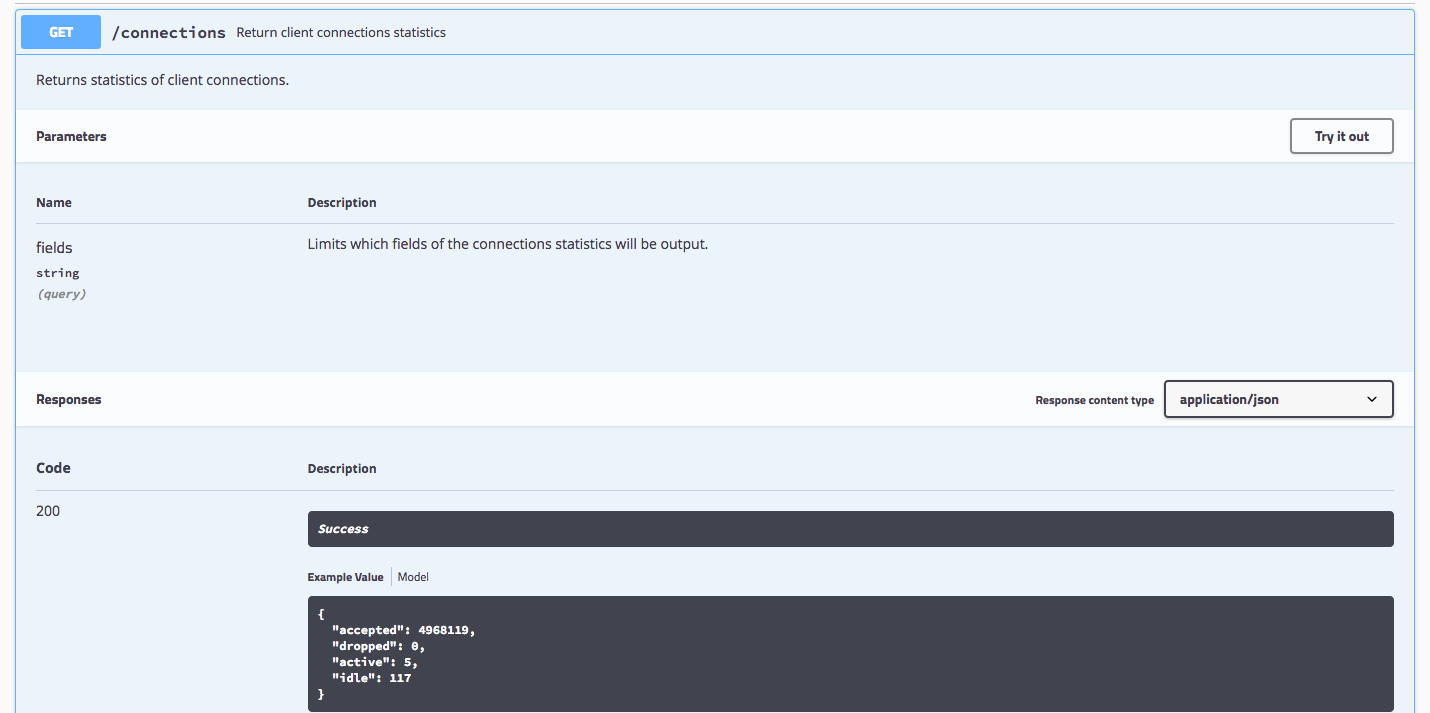
- Click on the operation you want to fulfil.
- Click Try it out.
- Fill in the obligatory fields, if required. Generally, the required field is the name of the shared memory zone.
- As an option you can display only particular fields. In the “Fields” line specify the fields you want to be displayed separated by commas. If no fields are specified, then all fields are displayed.
- Click Execute. The result and the corresponding HTTP error code will be displayed below the Execute command.
API Live Examples
NGINX provides live examples of JSON data and Swagger UI on a demo website.
Live example of JSON data is available at: https://demo.nginx.com/api/3/
You can send an API command with curl or with a browser:
curl -s 'http://demo.nginx.com/api/3/'
curl -s 'http://demo.nginx.com/api/3/nginx?fields=version,build'
curl -s 'http://demo.nginx.com/api/3/http/caches/http_cache'
curl -s 'http://demo.nginx.com/api/3/http/upstreams/'
curl -s 'http://demo.nginx.com/api/3/http/upstreams/demo-backend'
curl -s 'http://demo.nginx.com/api/3/http/upstreams/demo-backend/servers/0'
The Swagger UI demo page is available at: http://demo.nginx.com/swagger-ui/
Live examples operate in the read-only mode, resetting the statistics via the DELETE method and creating/modifying upstream servers with the POST/PATCH methods are not available. Also note that as the demo API is served over the HTTP protocol, it is required to choose the “HTTP” scheme in the “Schemes” menu on the Swagger UI demo page.
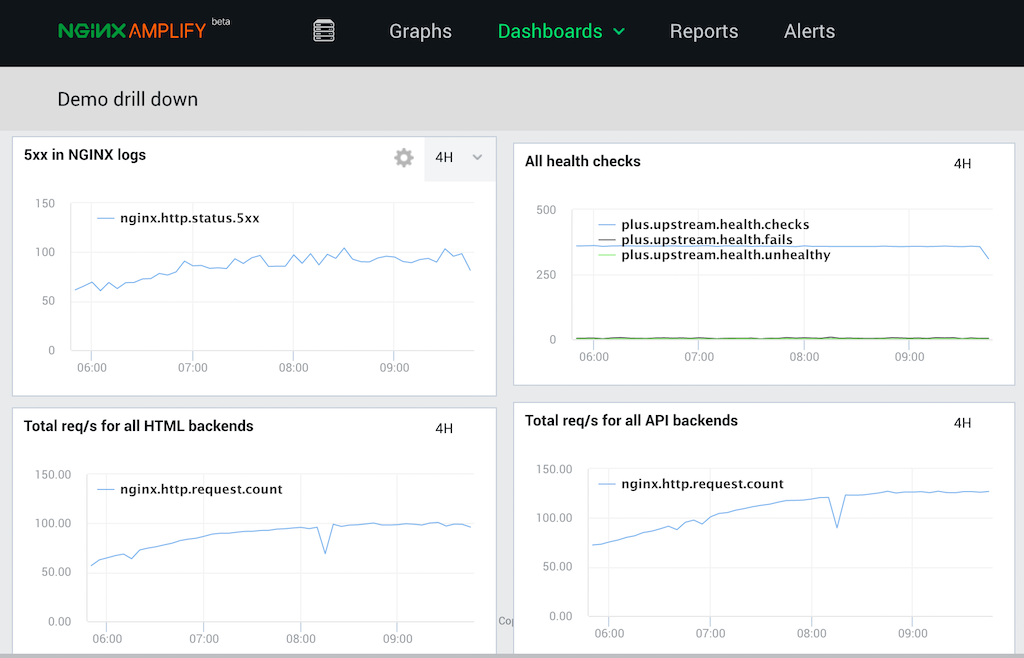
Monitoring NGINX with Amplify
NGINX Amplify is a monitoring tool that can be used to obtain additional insights into nginx performance.
With Amplify it is possible to collect and aggregate metrics across nginx servers, and present a coherent set of visualizations of the key performance data, such as active connections or requests per second. It is also easy to quickly check for any performance degradations, traffic anomalies. With Amplify static analyzer it’s possible to also get a deeper insight into the nginx configuration in general.
In order to use Amplify, a small Python-based agent software (Amplify Agent) should be installed.
More Info About Amplify
See Resources and Documentation for Amplify User’s Guide, FAQ, blog and webinars.
See Amplify Features and Specs for in-depth information about Amplify and its features.
You can sign up for free on the Amplify Signup page.